3D Geological Modeling and Subsurface Modeling Software for Borehole Data
TabLogs Visualiser turns boring logs, samples, and field data into 3D geological models and subsurface visuals, using industry-standard interpolation methods like IDW, SIS, and GIK. Generate fence diagrams, cross sections, and site plans directly from that model, then slot them straight into your geotechnical and environmental reports, without manual drafting or disconnected tools.
Data Visualisation
Interactive subsurface views
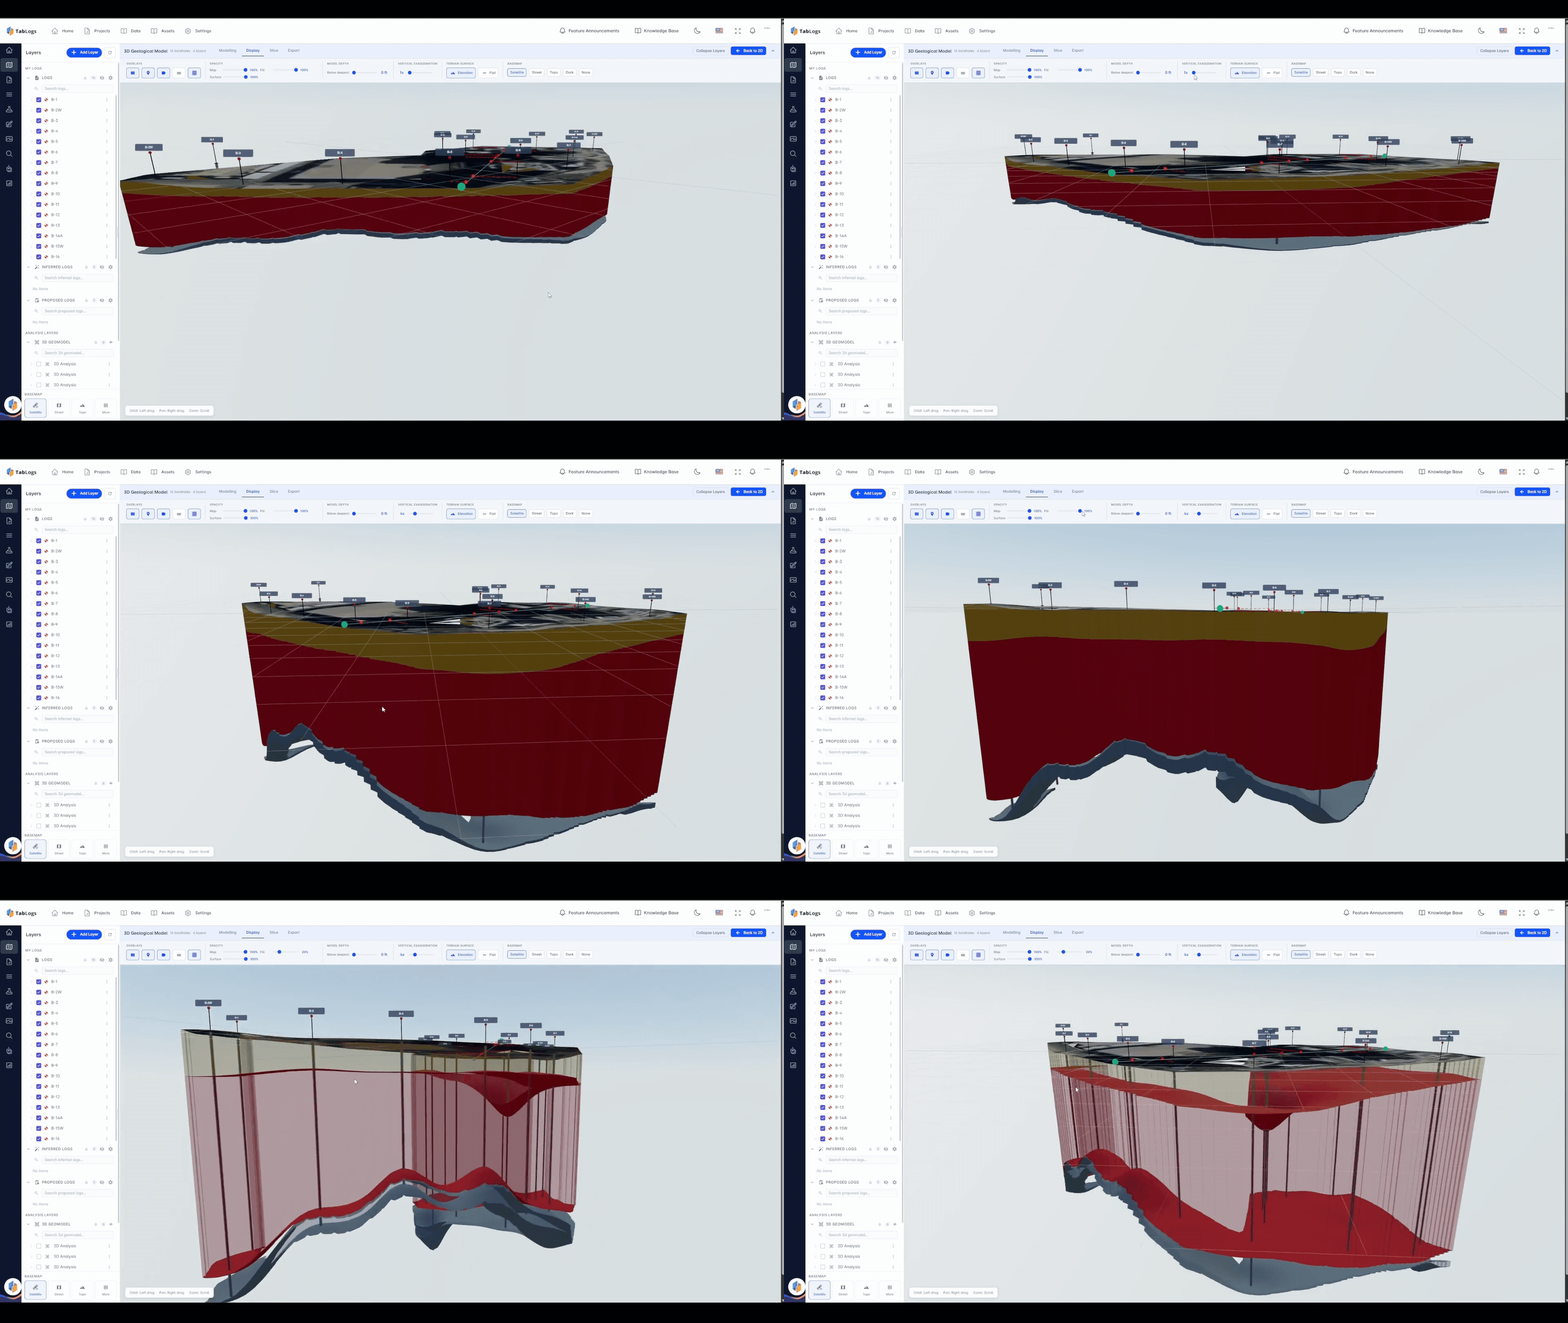
Visualize Boring Logs in 3D
Build a 3D subsurface model directly from your borehole logs using Inverse Distance Weighting (IDW), Sequential Indicator Simulation (SIS), or Geologic Indicator Kriging (GIK), depending on the geology and confidence level you need. Group your model by Origin, Material, Geomodel, or Classification Code, and exclude specific boreholes from a model without redrawing the site boundary. Inferred borings can be added and reordered directly inside the 3D view, so refining the model doesn't mean switching tools.
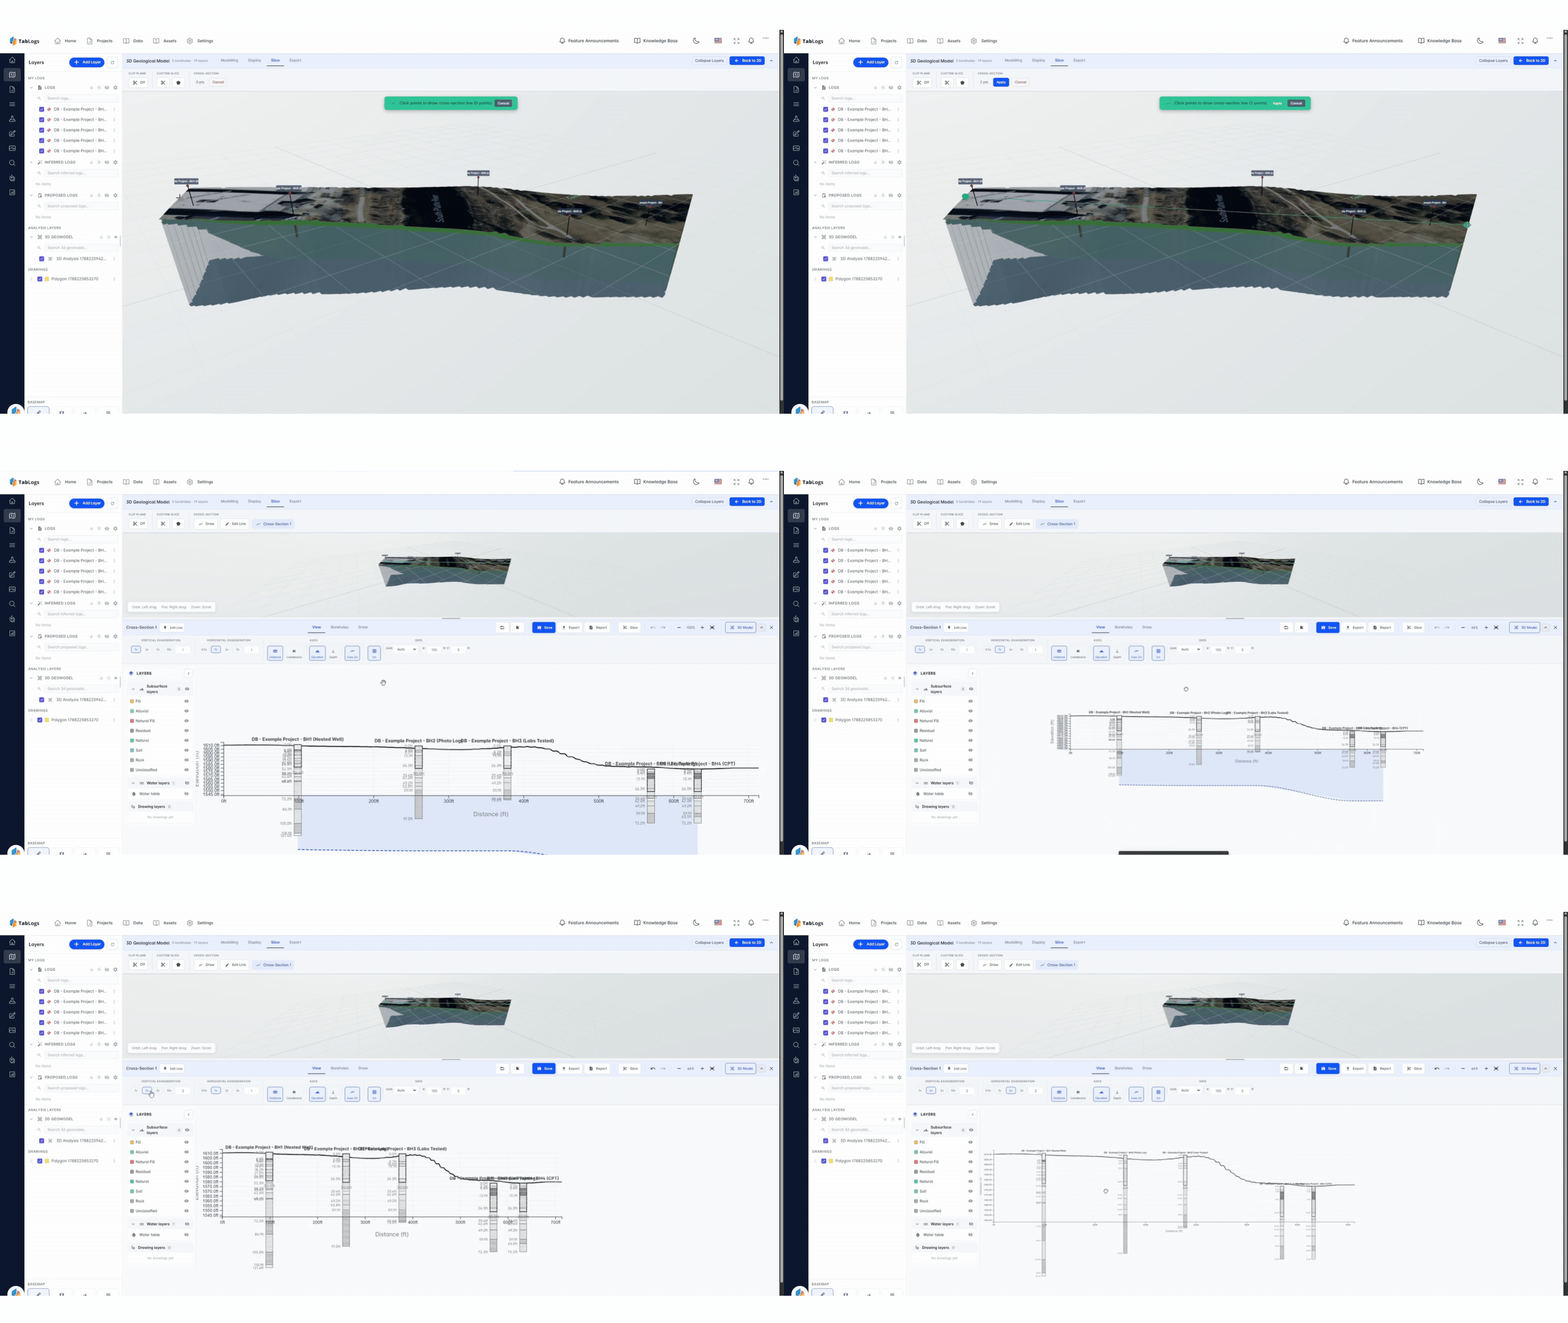
Professional Cross-Sections Without Rebuilding in CAD
Once your model exists, TabLogs generates the fence diagram or cross section from it automatically, with subsurface layers and standard geological fill graphics drawn in for you. The cross-section boundary is inherited directly from the model, so your fence diagram stays consistent with the geology as you refine it, rather than drifting out of sync with a separately drawn buffer. Sample layers are labeled "Sampled" or "Smart" so it's always clear which data reflects real field observations versus interpolated estimates. If further drafting is needed, exports are structured for use in Civil3D, OpenRoads, and AutoCAD, but for most geotechnical and environmental reporting, there's no CAD step at all.
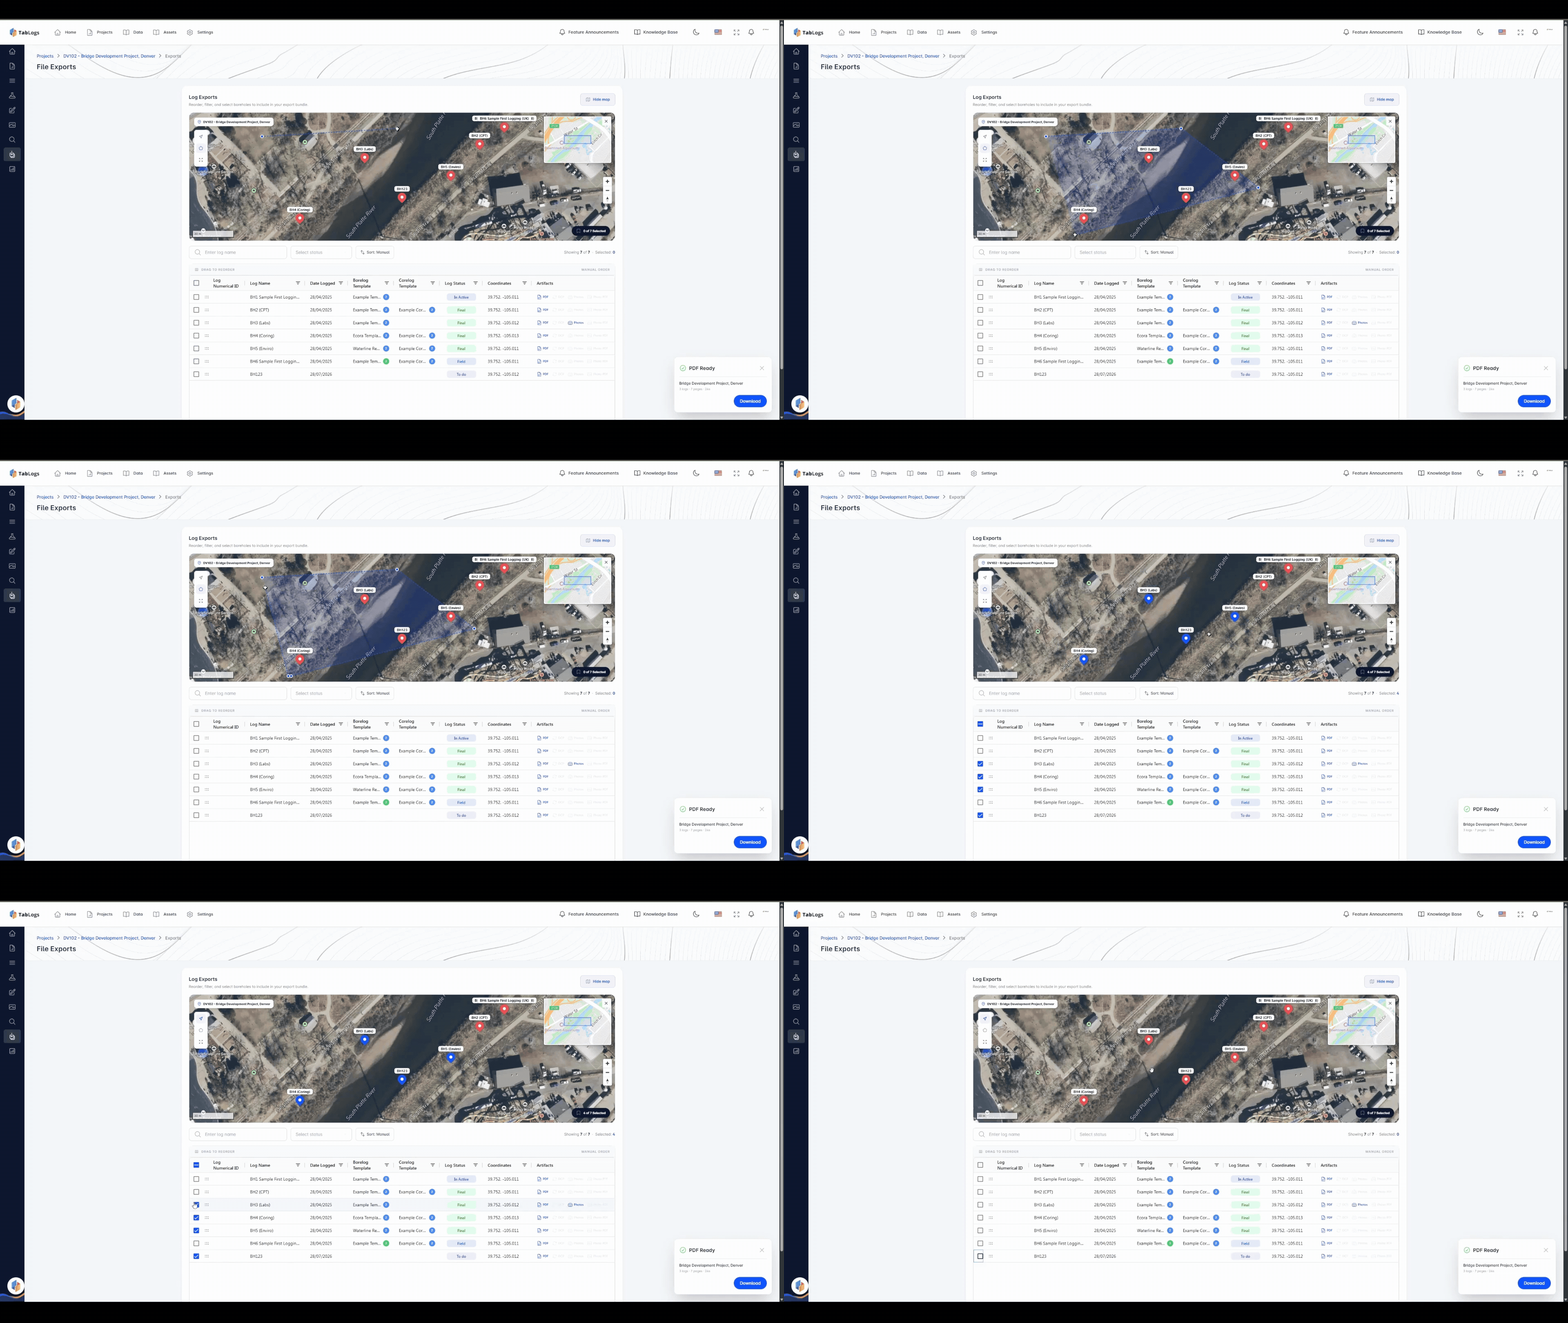
Map Boreholes with Interactive Site Plans
Place boreholes on an interactive site plan tied to the same underlying data as your 3D model and cross sections, so a change to a boring log updates every visual built from it. Base maps, drag-and-drop borehole positioning, and direct handoff into Report Builder mean the site plan stays connected to the rest of your subsurface data instead of existing as a separate drawing.
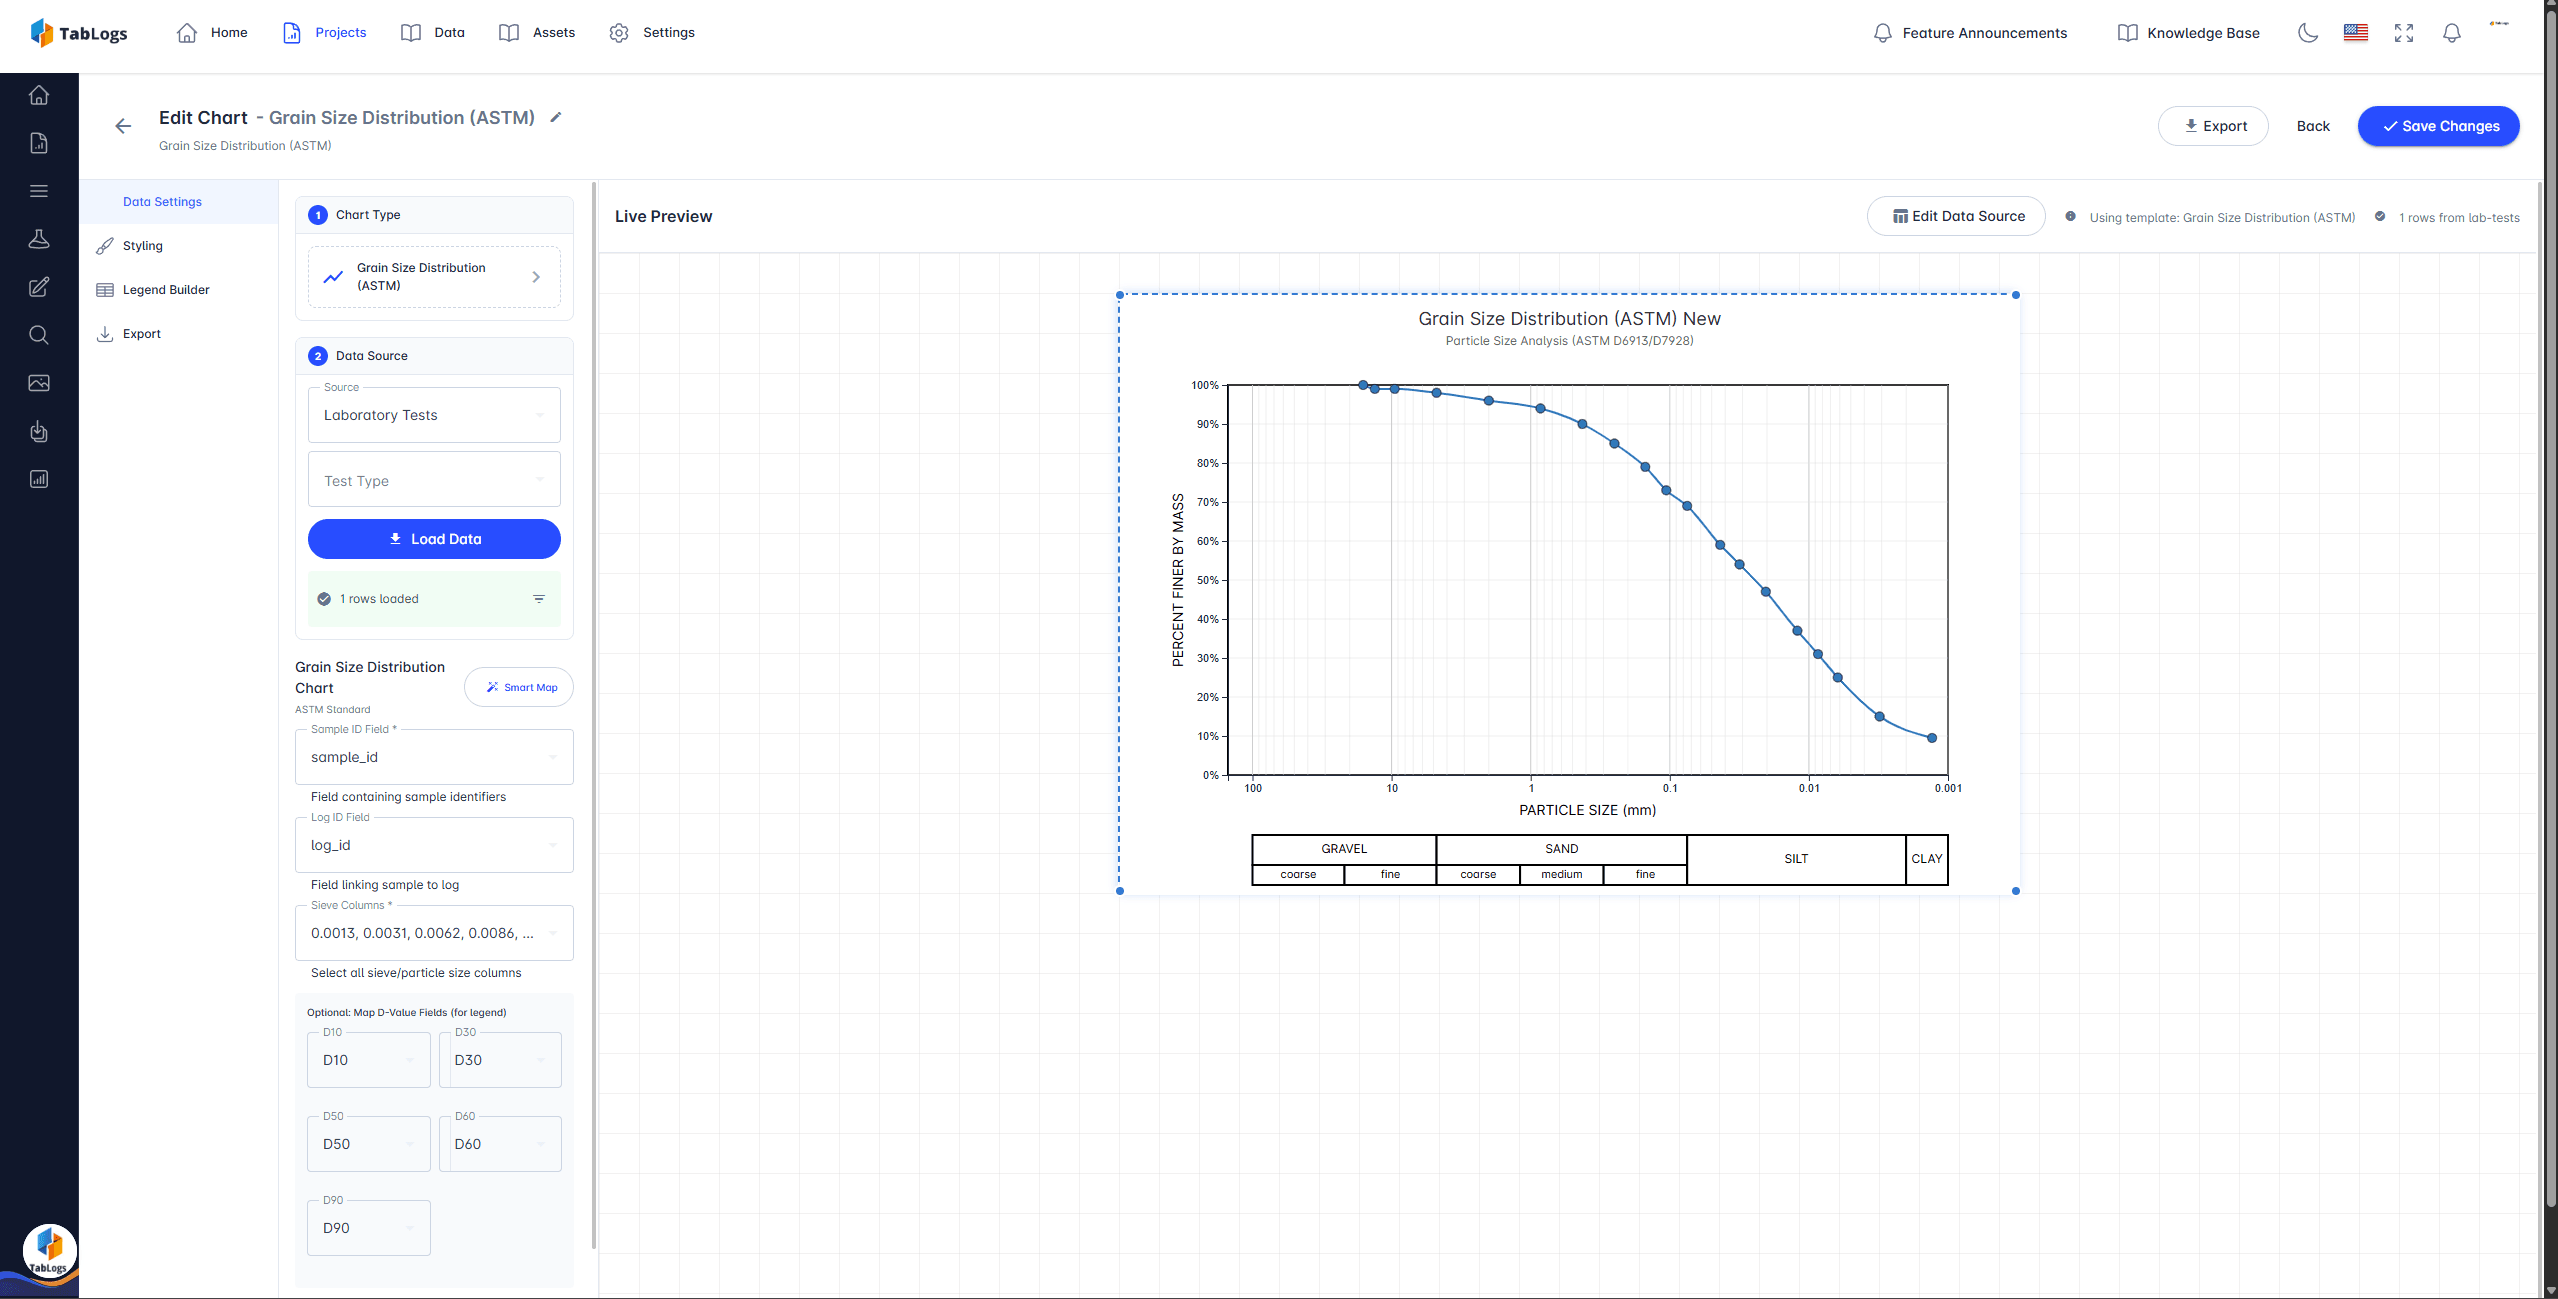
Built for Geotechnical and Environmental Reporting
Every model, fence diagram, and site plan generated in TabLogs flows directly into Report Builder using the same header, footer, and legend templates across your reports, so formatting doesn't get rebuilt project to project. Reports stay linked to the source model or cross section, with a re-pull option to resync the latest version without losing your layout. Figures stay consistent with your logged data throughout, reducing transcription errors and simplifying QA across larger projects.
Ready to visualise your data?
Create stunning cross-sections and site plans with TabLogs.